
Have You Set Your NPS Bar Too High?
Dig Into NPS Trends Before You Set Your Goals
Vast Variation
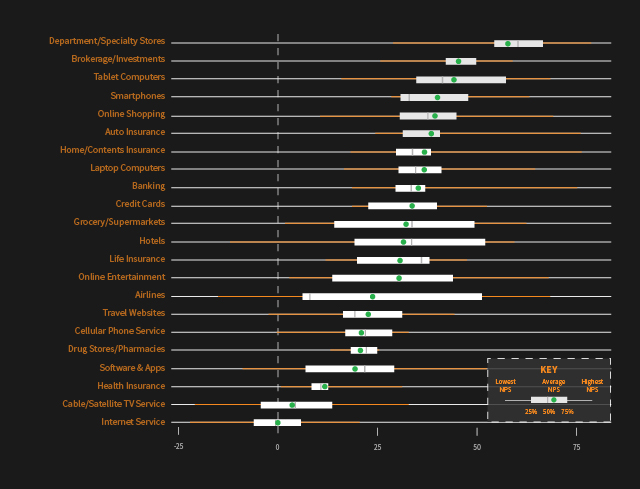
We’ve seen strong differences in NPS by industry ever since we first started collecting US consumer data 15 years ago. These are partly due to certain product categories being inherently more ‘recommendable’ than others, and partly due to broader market forces and competitive pressures.
Limited Choice, Low Scores?
Taking a look at the sectors with the lowest average Net Promoter scores (towards the bottom of the chart above), the telecommunications companies stand out, right at the bottom of the pile. That these companies have serious problems with competitiveness, customer service, and value for money is no secret.
But there could be other reasons for the low scores, too. For example, in many parts of the US, it may be that there’s so little choice in cable providers that a recommendation to a friend or college hardly makes sense. This doesn’t mean that these scores are not something for cable companies to worry about of course (we’re beginning to seeing strong signs of disruption in this sector).
Want It, Got It, Recommend It
By contrast, the sectors towards the top of the chart (with the highest average Net Promoter Scores) are rather different in a number of ways. Department stores, Brokerage, Tablet Computers and Online Shopping are all sectors where consumers might be said to be spending their discretionary income. It’s not stuff you need; it’s stuff you want.
In these higher-scoring sectors there’s a greater deal of choice and competition (so a recommendation is more meaningful), and purchases tend to be more individualized and expressive, with higher value placed on the brand itself. It’s also worth noting that many of these sectors are relatively new, and weren’t substantial consumer markets five or ten years ago.
Set Smart Goals
Mentioning industry differences in Net Promoter Scores isn’t to say that these rankings are set in stone. We’ve certainly seen them change over the years. Financial services sectors like credit cards and brokerage have been on a general upward trend since the global financial crisis, with similar patterns of increases for health and life insurance. Conversely, loyalty to grocery stores has seen gradual but consistent declines over the last five years, driven by increasing food prices and slow wage growth.
Even if you don’t have benchmarks, your internal NPS is still a great way to understand how to retain existing customers. Butseeing your score in context can alert you to competitive strengths and weaknesses — as well help you set goals which are both meaningful and realistic.